
Sell
CareIT · Business Operating System
Run the whole company on one system — with an AI that reads your live data.
Sales, operations, money, people, and service across 28 modules and one database — so a customer, an invoice, and a support ticket are finally the same record.
- Business modules
- 28
- Application screens
- 55
- MFA built in
- TOTP
- Accessibility gate
- AA
See it in action
The whole platform, in five minutes.
A narrated tour of the system — the dashboard and copilot, the pipeline, stock and purchasing, the finance cockpit, people and payroll, support, automations, and the governance underneath.
Platform snapshot
Everything a real company runs on.
Capabilities that ship today — not a wish list. Each one is a working, tested part of the platform.
28
Business modules
CRM through to the audit log
Copilot
Answers from live data
Every answer shows its working
Visual
Workflow automation
Canvas, run history, failure alerts
In words
Cash position
Stated before it draws a chart
SHA-256
Audit trail
Append-only and verifiable
55
Application screens
All reachable through the REST API
Role-based experience
One system. Every point of view.
Switch roles to see the real product each one gets — leadership, the sales floor, and finance and operations.
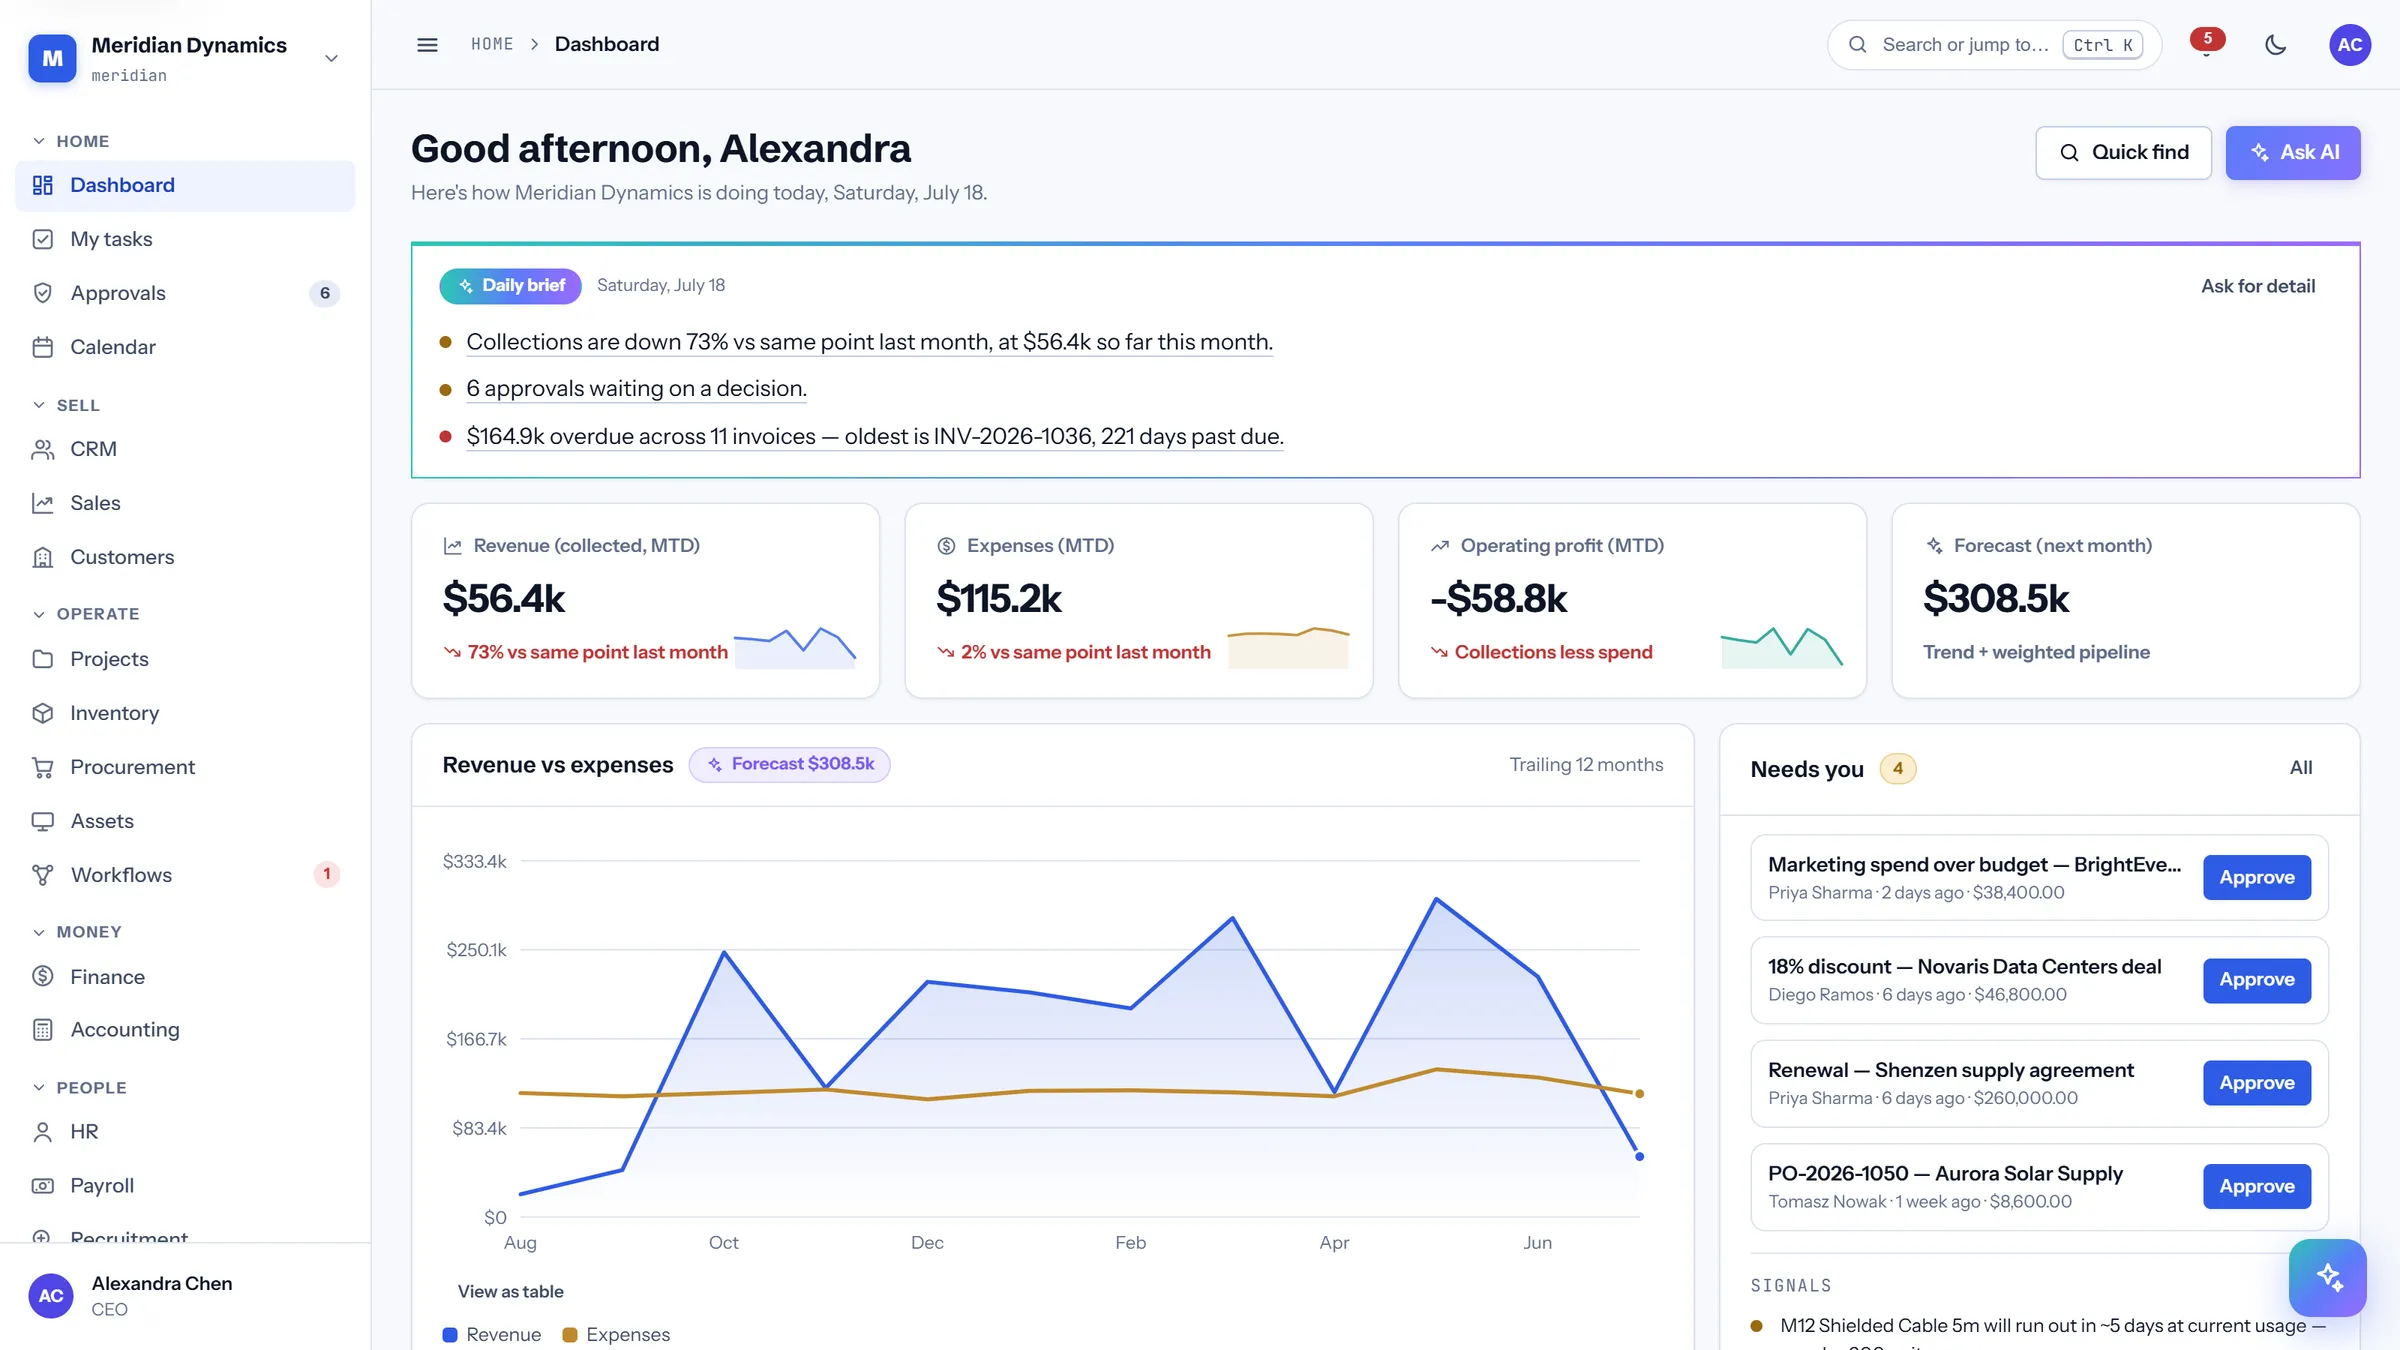
Leadership
Open the laptop and already know.
- An AI daily brief in plain sentences, each clause linking to the record behind it
- A role-aware KPI row: a CEO sees financials, a support lead sees the queue
- The approval queue promoted to the home screen, decidable in place
- Business health indicators that each state the threshold they are judged against
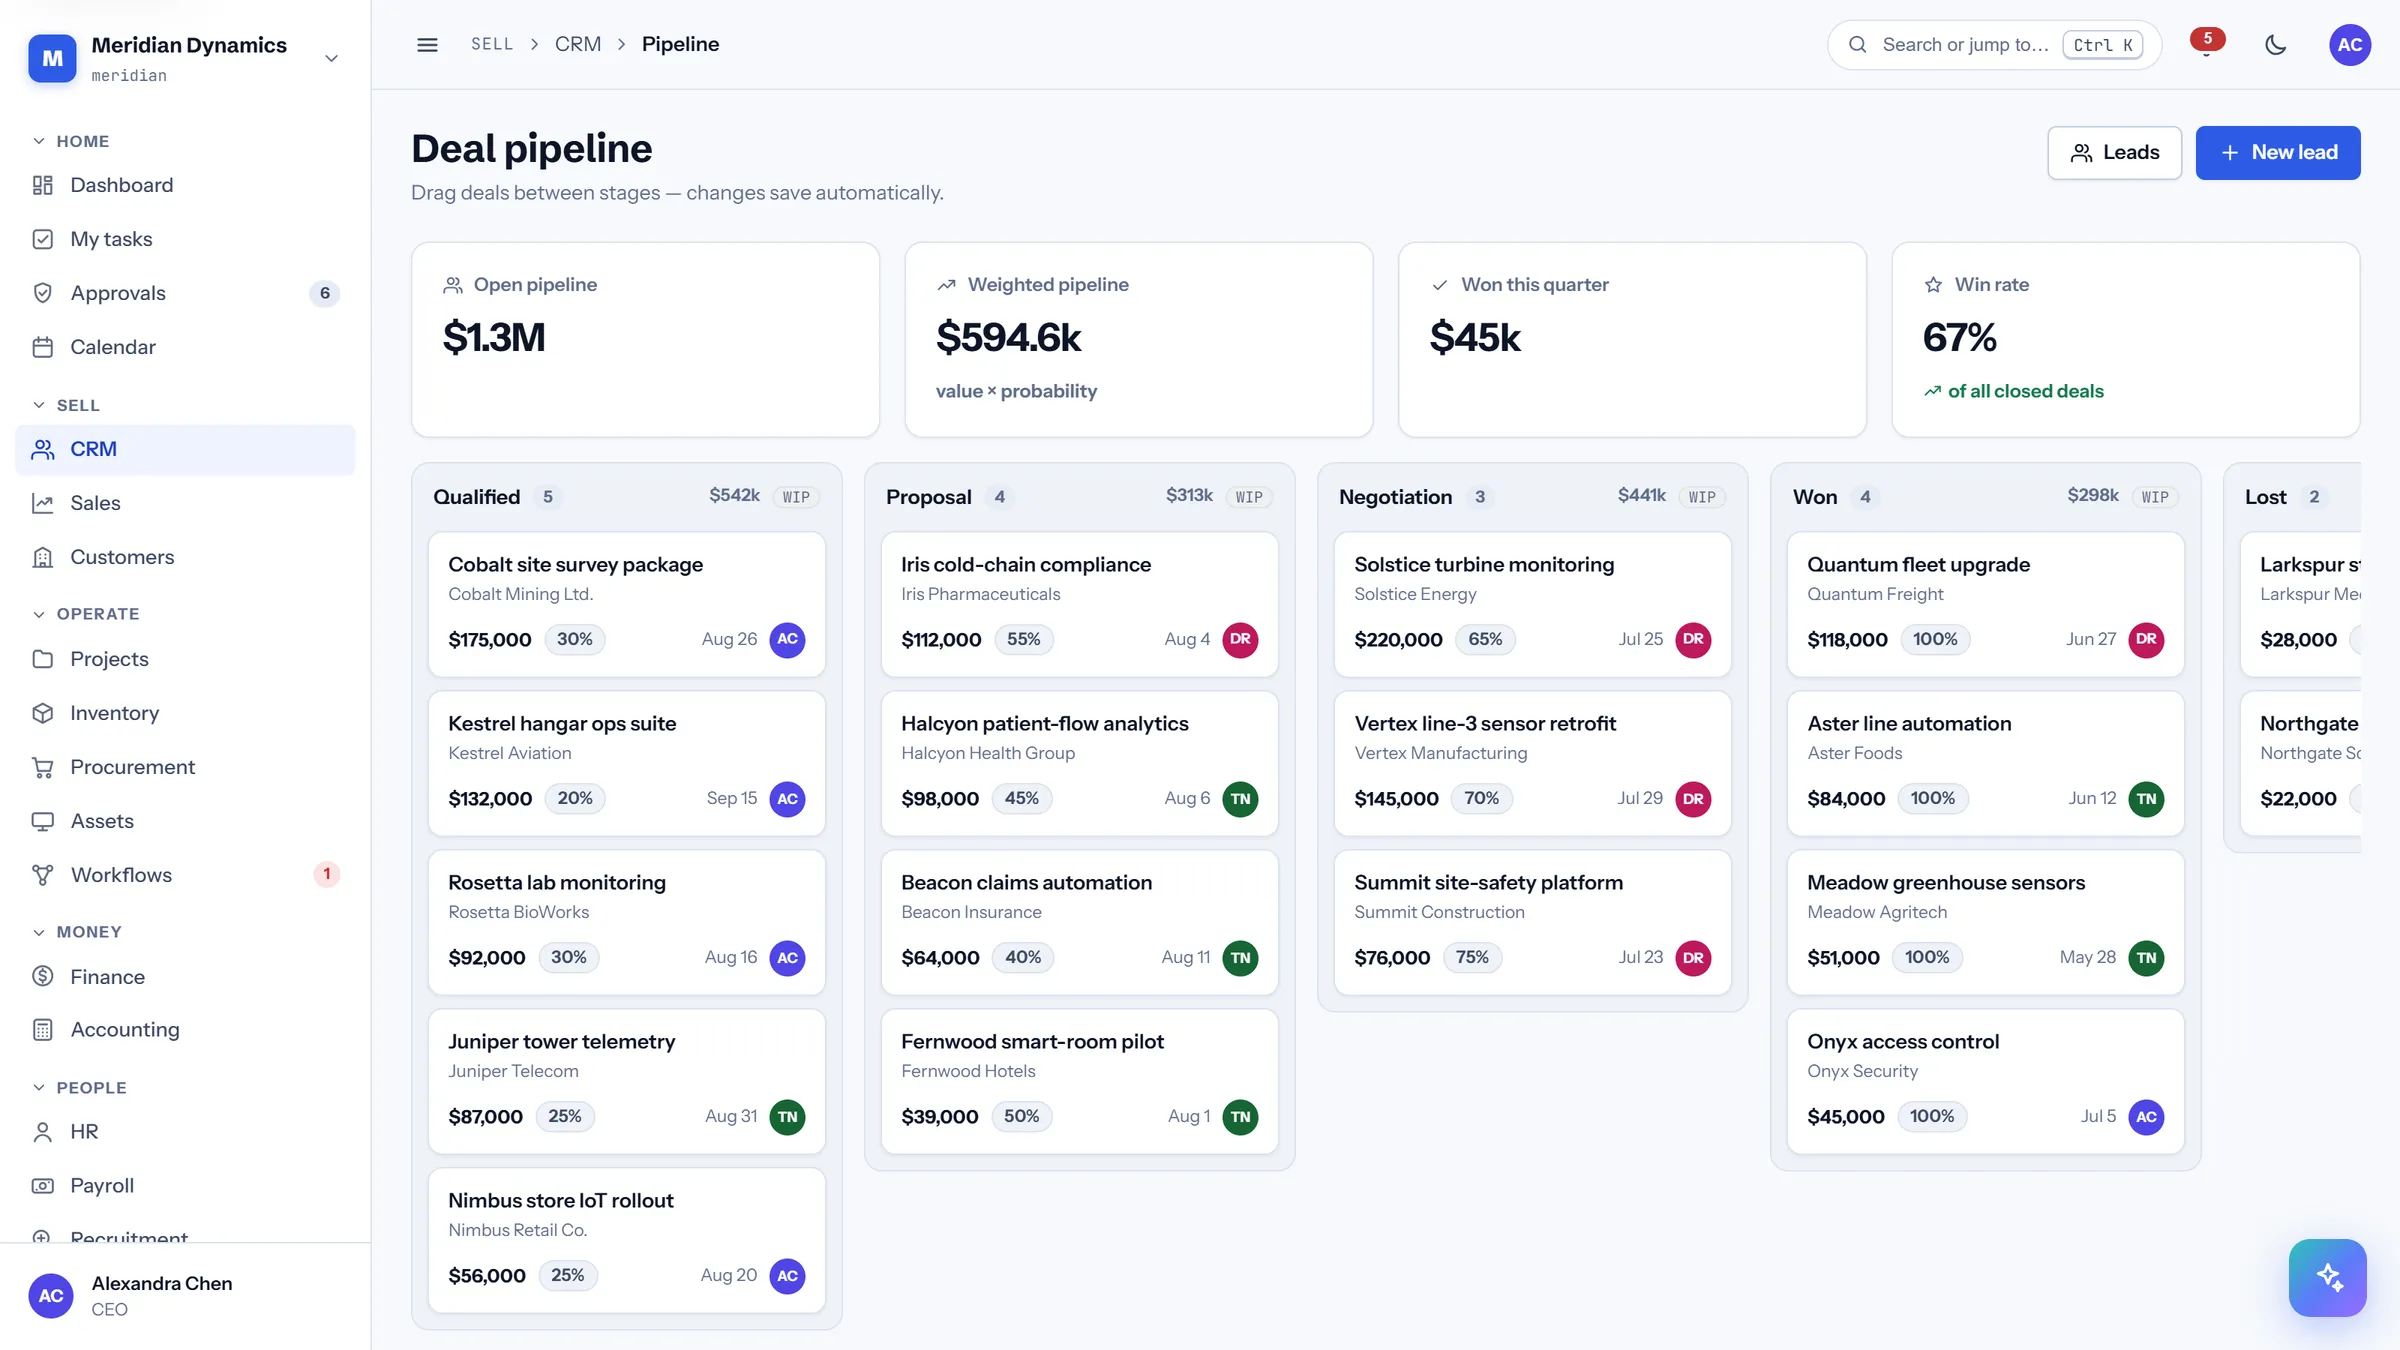
Sales floor
A pipeline that tells the truth.
- Lead scoring out of 100, with estimated value across open leads only
- Open and probability-weighted pipeline totals above the board
- WIP limits per stage, set by clicking the column header
- Keyboard moves throughout: Enter to pick up, arrows to choose, Enter to drop
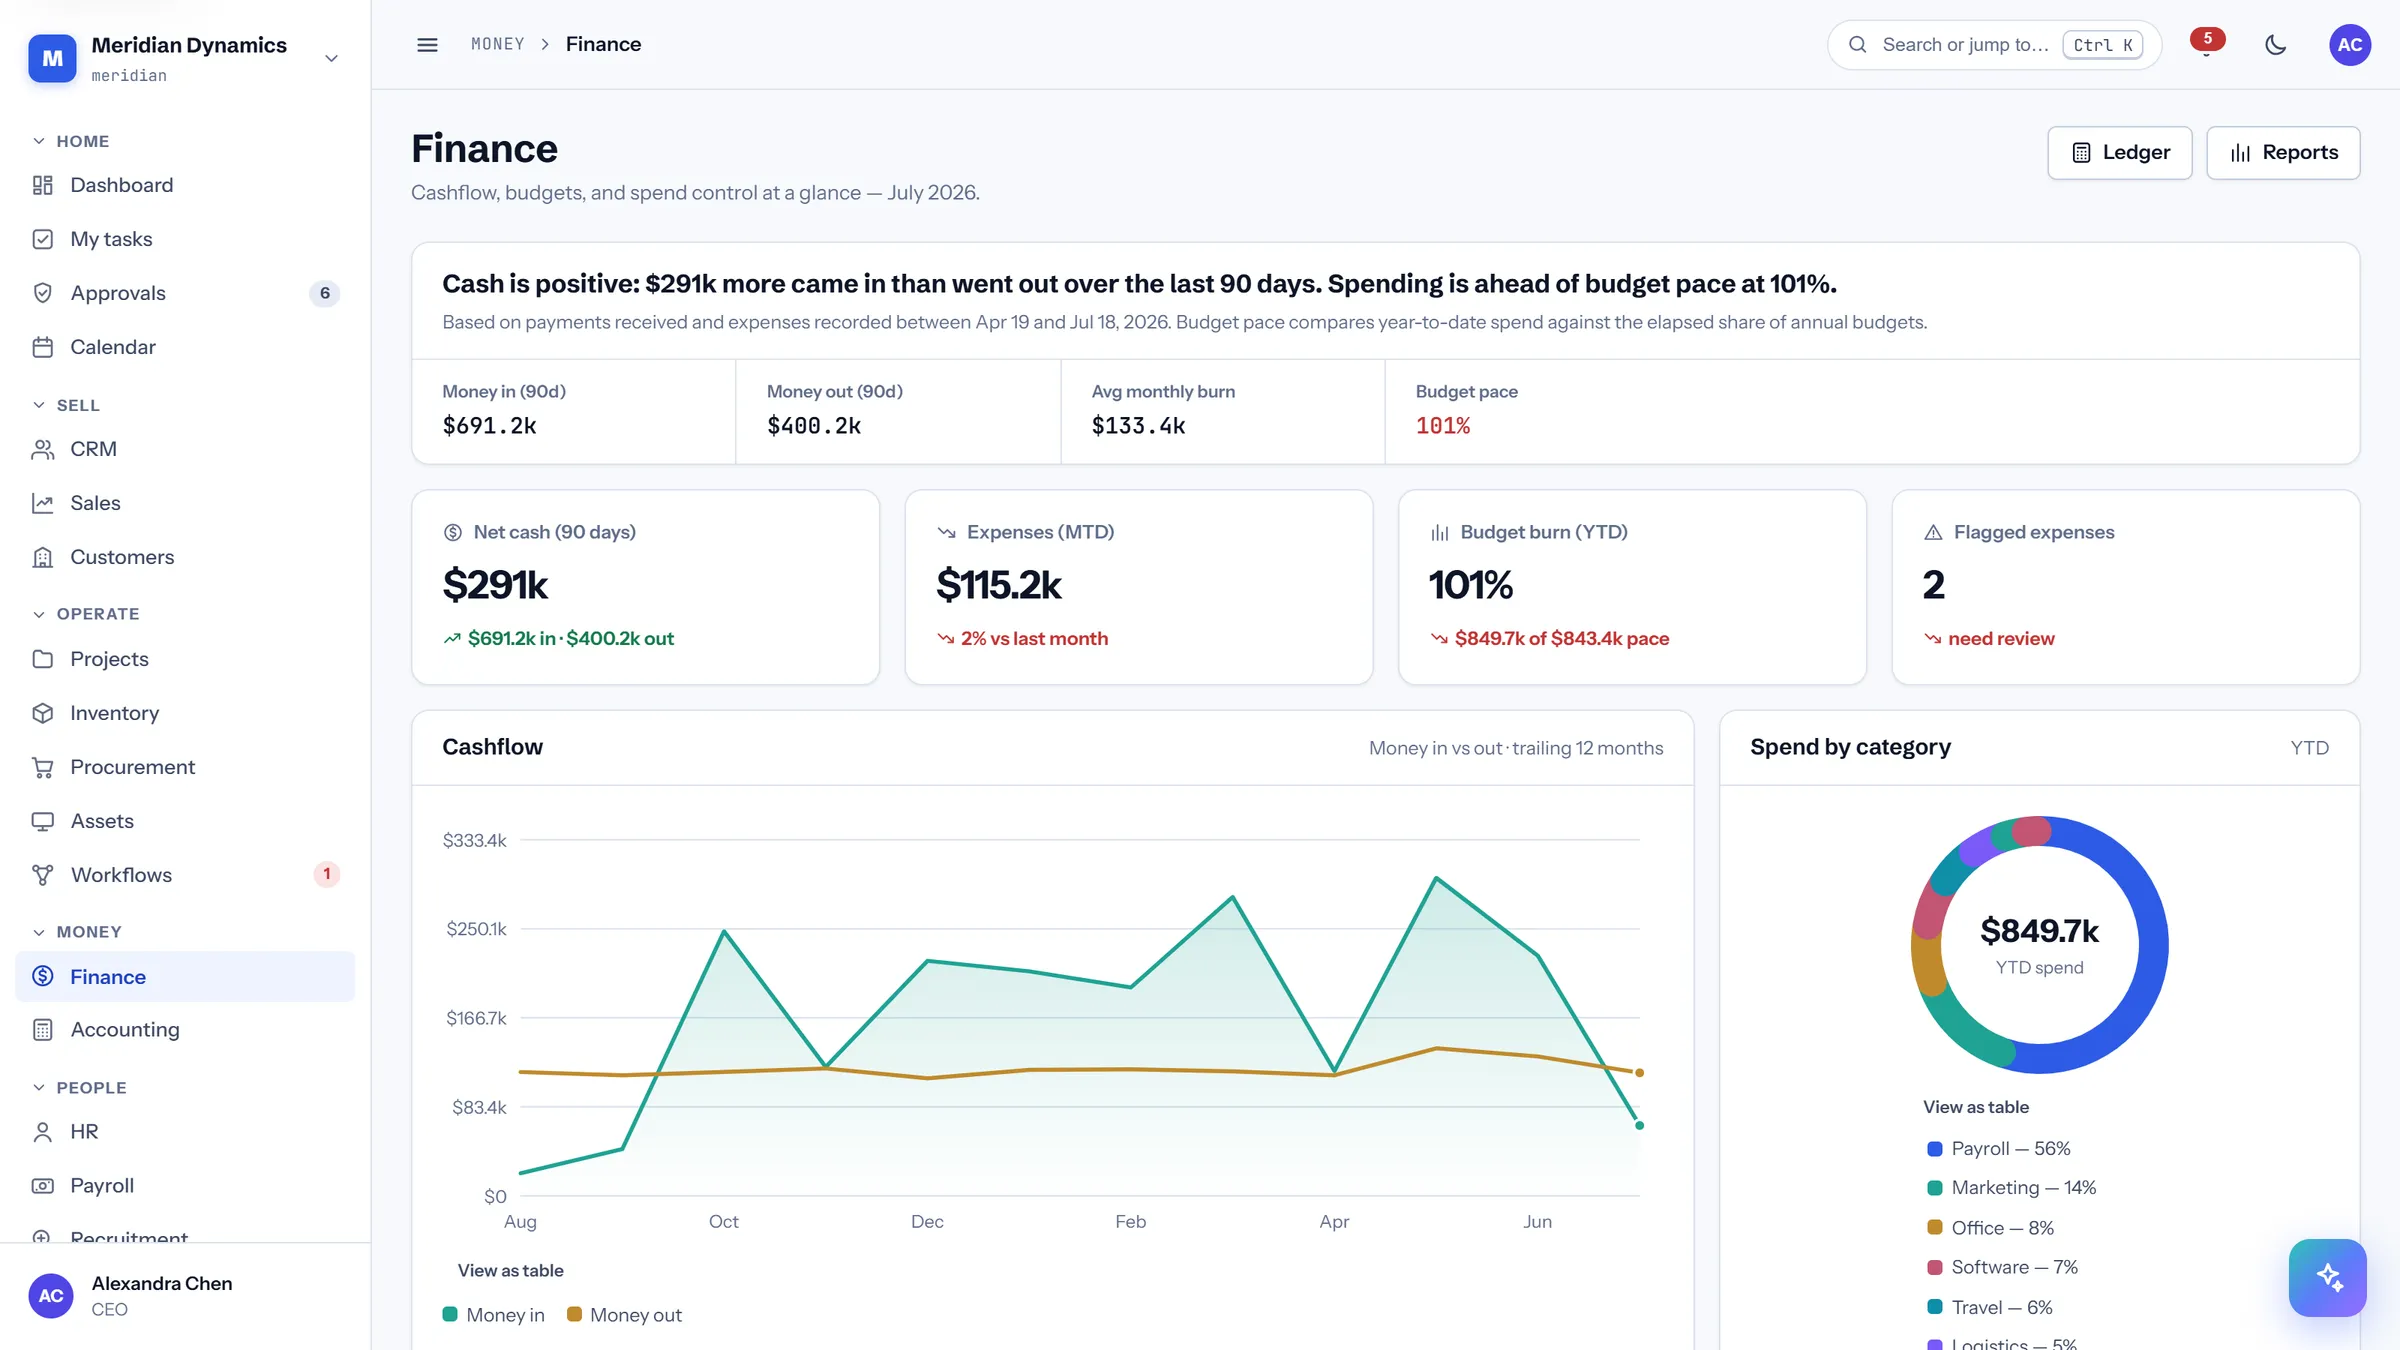
Finance & operations
The position, stated in a sentence.
- Cash position written in words, with the date window and basis named
- Net cash over ninety days, money in against money out
- Budget burn measured against elapsed pace, not against the annual total
- Flagged expenses surfaced with the anomaly rule that flagged them
Home · sell · operate · money · people · serve
Six domains, one database.
The application groups twenty-eight modules into six domains, and this site follows the same map. Bars shown are illustrative.
The copilot
It shows its working, every time.
Ask what happened this week, what next month looks like, or which products run out first. The copilot runs the query against your own database and returns the result with the window, the record counts, and the basis printed underneath — because an answer you can’t audit is an answer you can’t use.
- Questions are routed to a computation, not to a language model
- The answer arrives complete — there is no token-by-token reveal, because there is nothing being generated
- Sources are listed under every answer: window, counts, and basis
- Ask from the dashboard, the palette, or the Explain button on any figure
Not a language model. Answers are computed, not generated — so there is no hallucinated figure to catch, and no per-question credits to buy.
Insights & reporting
Decisions, not just dashboards.
Revenue vs expenses · trailing 12 months
41% marginBudget burn · year to date
$1.3M
Open pipeline
$2.54M
Active ARR
293
Automation runs
1.8h
Avg first reply
Figures shown are from the seeded demo workspace, not customer data. Every chart in the product carries a text summary, responds to the keyboard, and offers a “view as table” toggle.
Money
Numbers that agree with each other.
Most business dashboards quietly disagree, because each screen picks its own window. Invoices are built from the catalog with line maths that reconcile, and every comparison runs against the same elapsed span.
- Invoices built from the product catalog, with line amounts and totals recalculated live
- Amount due tracked separately from invoice total, so part-payments are always visible
- Month-to-date means month-to-date — never quietly including future-dated payments
- Comparisons run against the same elapsed span: “vs same point last month”, and it means it
- Posted journal entries are corrected by new entries, never edited away
Governance, engineered
An audit trail you can verify, not just trust.
Most systems offer an activity log you are invited to believe. This one chains every record with SHA-256 and ships the command that re-walks the chain — so if a row were ever altered, the break has a location.
- Append-only: entries are added, never updated or deleted
- Each record carries the hash of the one before it
- A verification command re-walks the chain and reports the first broken link
- Exports are audited too — data leaving the platform is an event, not a silence
Security & access control
Confidence for IT. Simplicity for the team.
MFA on every account
Time-based one-time codes with QR enrollment and segmented entry — on every edition, never held back for an enterprise tier.
Permissions per module and verb
A role matrix of every module against view and manage, where “manage implies view” is shown in the interface before you save it.
A tamper-evident audit trail
Append-only and chained with SHA-256, with a verification command that re-walks the chain and reports the first broken link.
Files scanned before they land
Scanning runs inside the upload request. An infected file raises an error and is never stored — there is no quarantine to forget about.
Writes that cannot double-post
The API requires an Idempotency-Key on every write, and a transactional outbox guarantees events reach their destination.
Isolated by architecture
Every workspace is scoped at the query layer, and your data exports in full on request. If you ever leave, it goes with you.
Implementation roadmap
From proposal to go-live, in clear steps.
- 01
Discovery
Company profile, departments, the processes you actually run, and rollout scope — one working session.
- 02
Foundation
Your workspace provisioned: users, roles built on the permission matrix, catalog, and chart of accounts.
- 03
Commercial spine
CRM, sales, customers, projects, approvals, and reporting go live first.
- 04
Operations & money
Inventory, procurement, assets, finance, and accounting switch on per edition.
- 05
People & service
HR, payroll, recruitment, helpdesk, and the knowledge base — enabled as each team is ready.
- 06
Automate
We build automations for your top three manual processes, so the system saves time in week one.
- 07
Go-live
Cutover with our team on standby, then PH-based support in your timezone.
Ready when you are
Let’s put your whole company on one system.
A 30-minute walkthrough on the real product, then an implementation plan scoped to your company.